
The distance penalty is real — and consistent
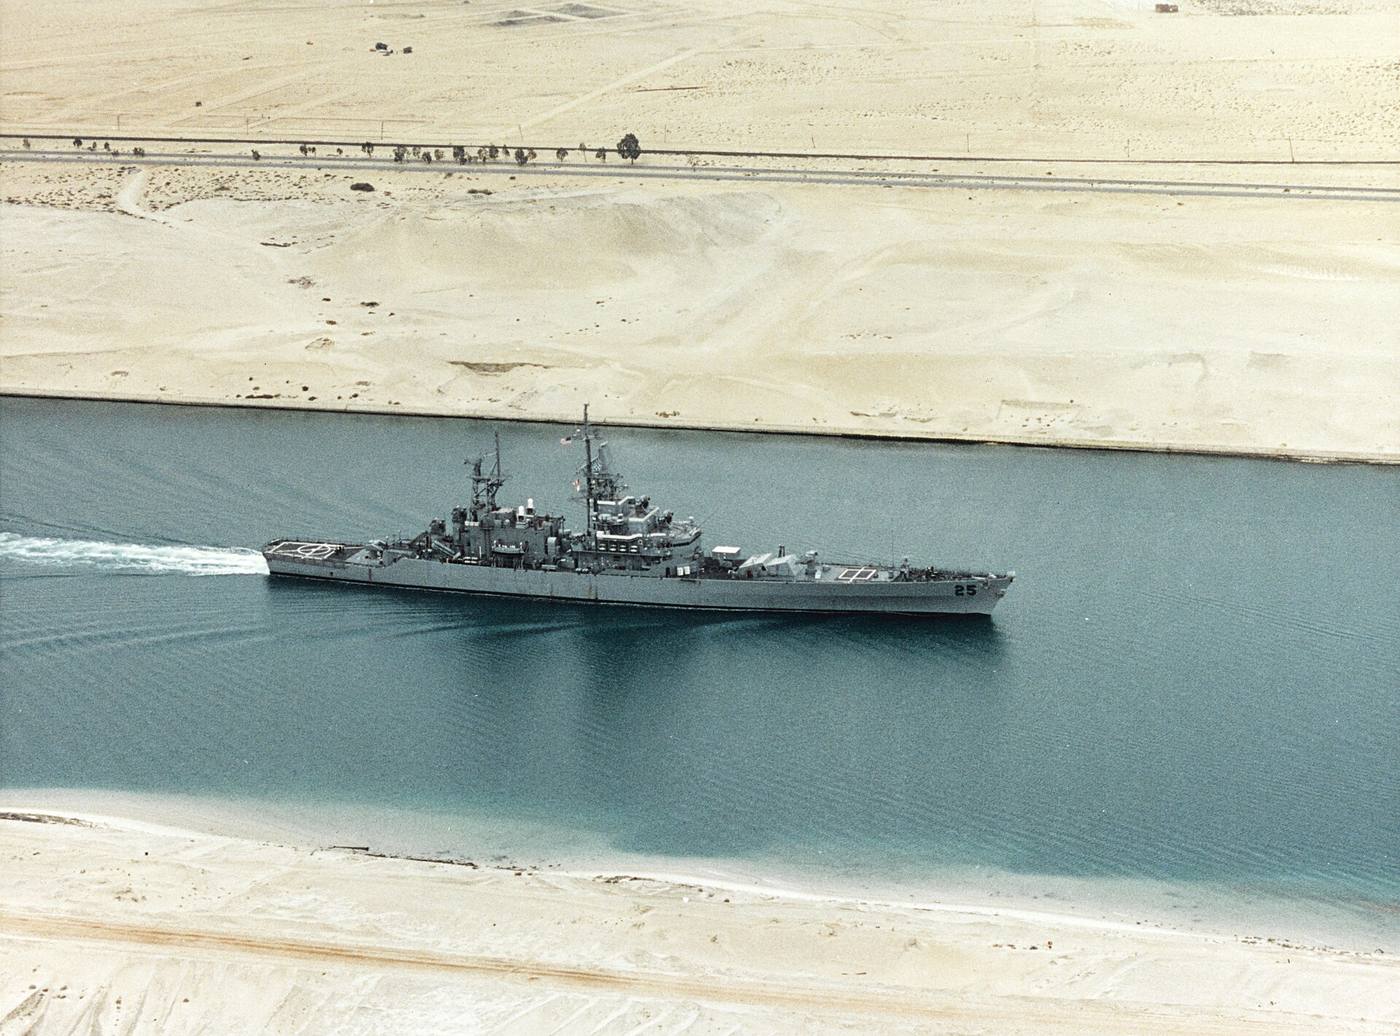
On the modelled maritime network, Rotterdam–Singapore measures 8,368 nautical miles transiting the Suez Canal. The same pair with all canals closed routes via the Sunda Strait and around South Africa for 11,856 nautical miles — a difference of 3,488 nm, about 42% more distance. Other Asia–Europe lanes show the same shape of penalty:
What the extra miles cost
Take the Rotterdam–Singapore case at a worked example: 14 knots, 30 mt/day fuel consumption, $650/mt bunkers, $25,000/day vessel cost.
- Via Suez: 24.9 days → ~747 mt fuel → about $1.11M in fuel and hire, plus the canal toll.
- Via the Cape: 35.3 days → ~1,058 mt fuel → about $1.57M in fuel and hire, no toll.
The difference — roughly $460,000 on this profile — is the breakeven toll: if a Suez transit costs you less than that, the canal wins on cash alone. Consumption, hire rate and cargo urgency all move the answer, which is why the number is best computed per voyage rather than quoted as a rule of thumb.
What the arithmetic doesn't capture
The comparison above is sea distance and sea time only. Real diversions also change bunkering ports, insurance and war-risk premiums, crewing, weather exposure around the Cape, and canal convoy scheduling on the Suez side. Neither figure is a fixture price or a routing order — it is a screening number for a decision that belongs to the commercial and marine teams with current information.
Run it with your own numbers
The same routing data and cost model are live in the canal vs. open-sea calculator — pick your ports, enter your toll from the official Suez or Panama canal calculators, and it returns the breakeven toll for your voyage profile.
Distances are modelled over the MARNET maritime routing network between WPI port positions — planning estimates, not voyage plans. Costs shown are worked examples at stated assumptions, not market quotes. Verify canal tariffs with the official authorities and routing decisions with your master, charterer and flag guidance.